

Simplify IP Utilization Monitoring in Subnets with Serverless Automation

A
AWS Hero 📍 🇳🇿🥝 | Enabling DevOps 👨💻 | ☁️ AWS Fanboy
Search for a command to run...
AWS Hero 📍 🇳🇿🥝 | Enabling DevOps 👨💻 | ☁️ AWS Fanboy
No comments yet. Be the first to comment.
kro and ACK
Before we dive into Cross Account Pod Identity support, let's review some history. In the early days of EKS, if a pod needed to access another AWS resource, it had to use the Node IAM role. For example, if an app running in a pod needed to access an ...
Simplify Your EKS Deployments with Native AWS CodePipeline Support
💡 Note: I hope you already have a good understanding of Amazon EKS and Kubernetes. If not, you might find some parts difficult to follow. However, feel free to ask any questions, and I will be happy to help. During AWS re:Invent 2024, one of my fa...
I want to begin with saying that Amazon Q developer and AWS Infrastructure Composer helped me to design this solution in a matter of minutes.
Amazon Q: https://aws.amazon.com/q/ AWS Infrastructure Composer: https://aws.amazon.com/infrastructure-composer/
Let's discuss the problem I'm attempting to tackle. IP exhaustion, which occurs when given subnets run out of IPs, is a problem that may arise if you are using Amazon EKS and your workload is growing.
Unless you have IPAM, AWS CloudWatch metrics do not support them at the time I am writing this blog. Monitoring your available IP addresses in subnets without the use of IPAM is what I'm attempting to accomplish here.
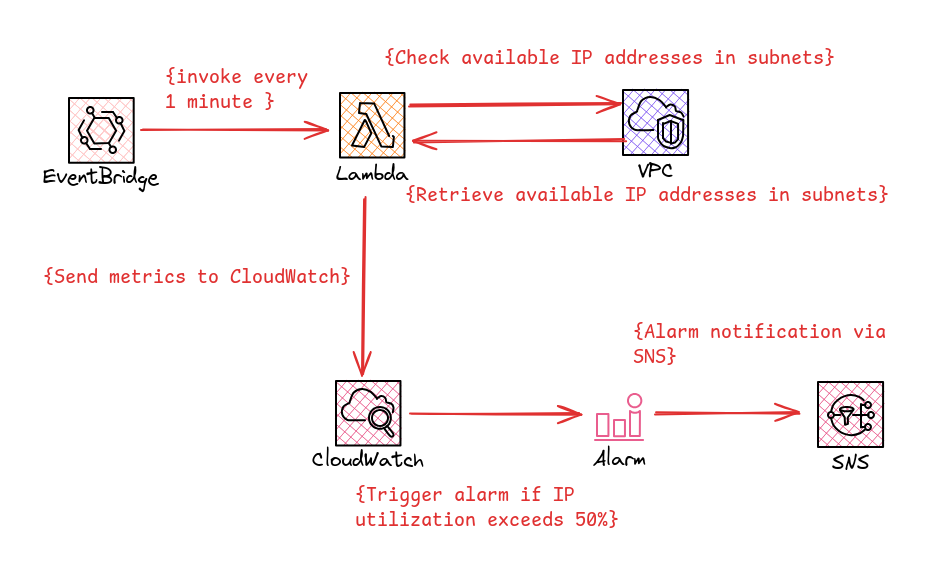
AWS Services involved in this solution:
AWS Lambda
Event Bridge Scheduler
Amazon CloudWatch Metrics
Amazon CloudWatch Alarm
Amazon SNS
I was able to create this in a matter of minutes with the help of Amazon Q Developer, however, I obviously needed to make a few little adjustments. This is very beneficial if you understand the basics and what you are doing. Instead of configuring AWS services blindly, I recommend everyone to better understand AWS services.
import boto3
import os
from botocore.exceptions import ClientError

def lambda_handler(event, context):
    vpc_id = os.environ['VPC_ID']
    subnet_ids = os.environ['SUBNET_IDS'].split(',')
    namespace = os.environ['NAMESPACE']

    ec2 = boto3.client('ec2')
    cloudwatch = boto3.client('cloudwatch')

    try:
        response = ec2.describe_subnets(
            Filters=[
                {'Name': 'vpc-id', 'Values': [vpc_id]},
                {'Name': 'subnet-id', 'Values': subnet_ids}
            ]
        )

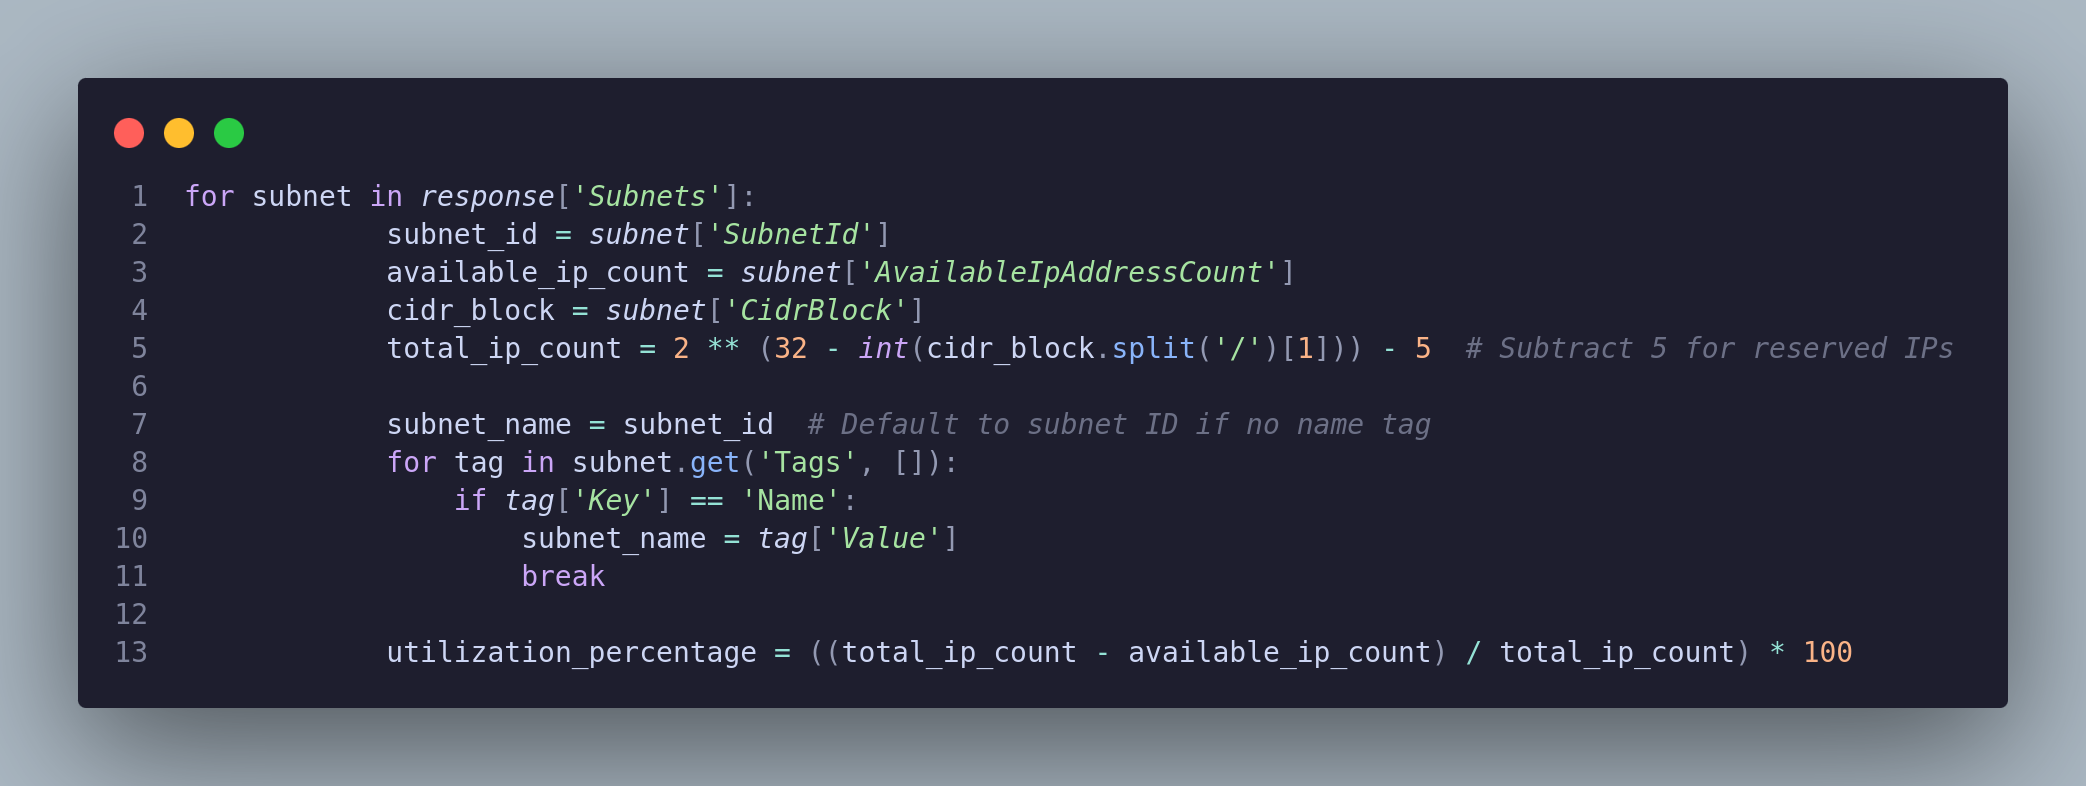
        for subnet in response['Subnets']:
            subnet_id = subnet['SubnetId']
            available_ip_count = subnet['AvailableIpAddressCount']
            cidr_block = subnet['CidrBlock']
            total_ip_count = 2 ** (32 - int(cidr_block.split('/')[1])) - 5  # Subtract 5 for reserved IPs

            subnet_name = subnet_id  # Default to subnet ID if no name tag
            for tag in subnet.get('Tags', []):
                if tag['Key'] == 'Name':
                    subnet_name = tag['Value']
                    break

            utilization_percentage = ((total_ip_count - available_ip_count) / total_ip_count) * 100

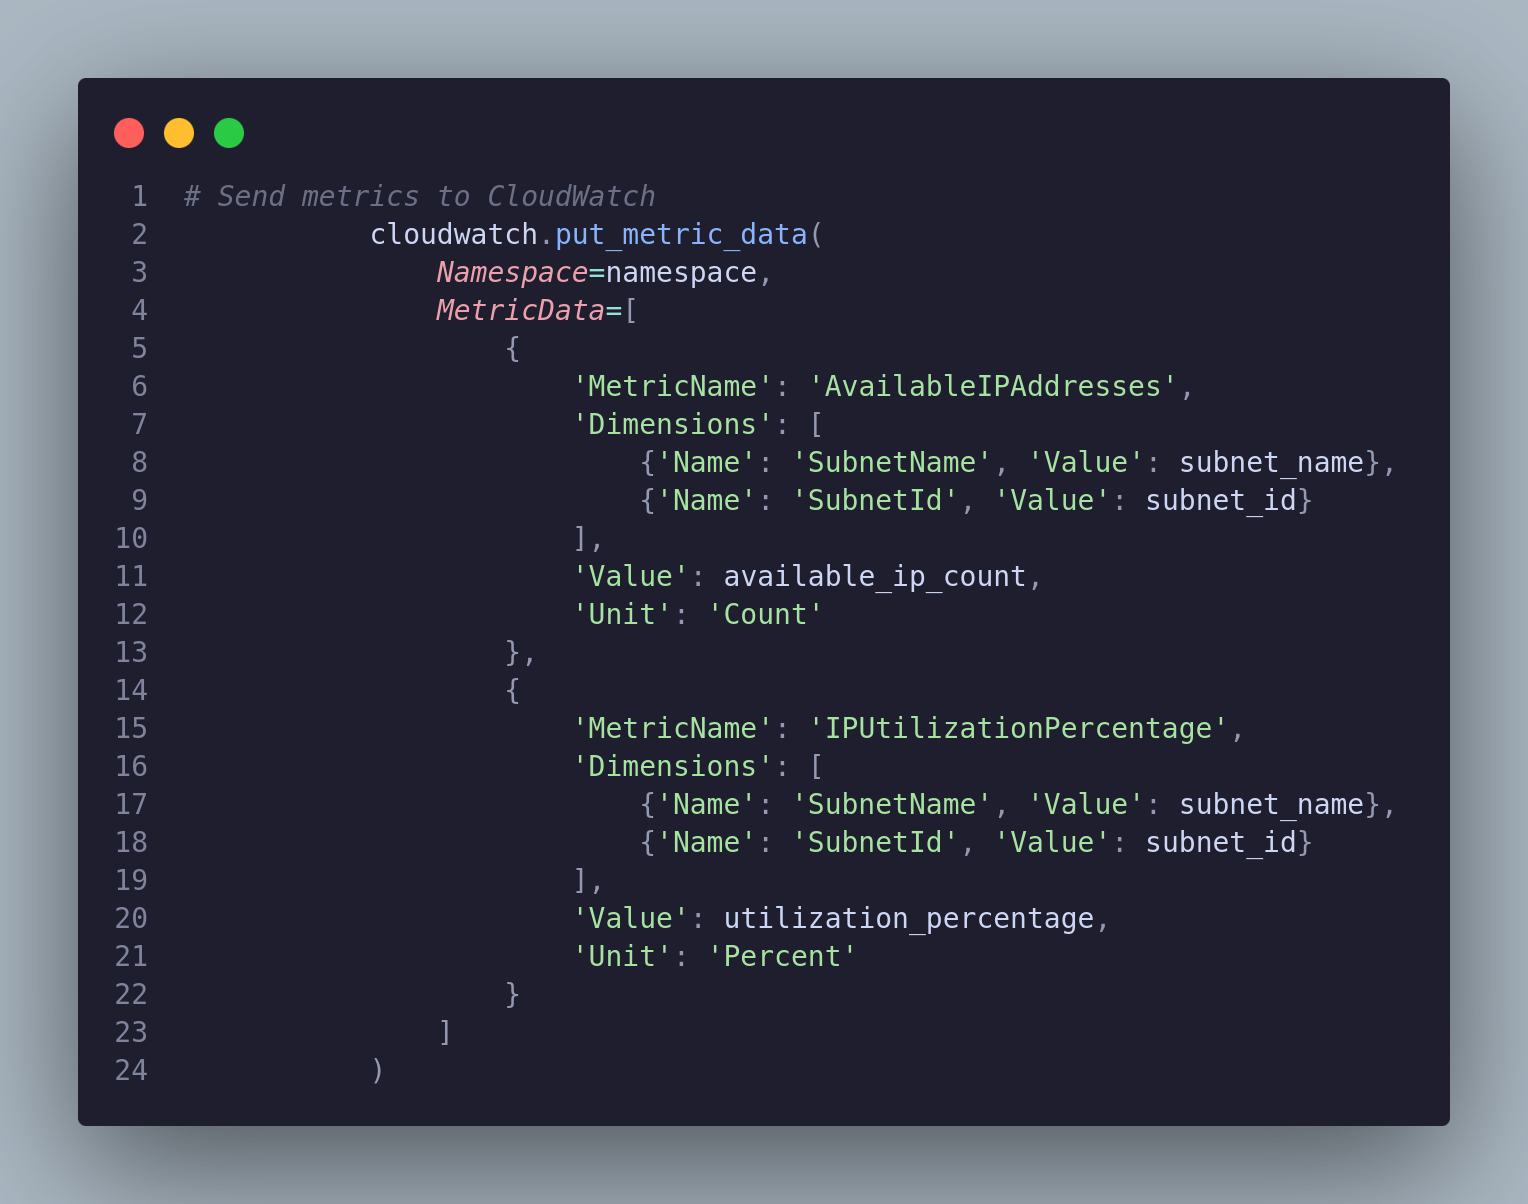
            # Send metrics to CloudWatch
            cloudwatch.put_metric_data(
                Namespace=namespace,
                MetricData=[
                    {
                        'MetricName': 'AvailableIPAddresses',
                        'Dimensions': [
                            {'Name': 'SubnetName', 'Value': subnet_name},
                            {'Name': 'SubnetId', 'Value': subnet_id}
                        ],
                        'Value': available_ip_count,
                        'Unit': 'Count'
                    },
                    {
                        'MetricName': 'IPUtilizationPercentage',
                        'Dimensions': [
                            {'Name': 'SubnetName', 'Value': subnet_name},
                            {'Name': 'SubnetId', 'Value': subnet_id}
                        ],
                        'Value': utilization_percentage,
                        'Unit': 'Percent'
                    }
                ]
            )

            print(f"Metrics sent for Subnet: {subnet_name} (ID: {subnet_id})")

    except ClientError as e:
        print(f"An error occurred: {e}")
        return {
            'statusCode': 500,
            'body': str(e)
        }

    return {
        'statusCode': 200,
        'body': 'Subnet monitoring completed'
    }
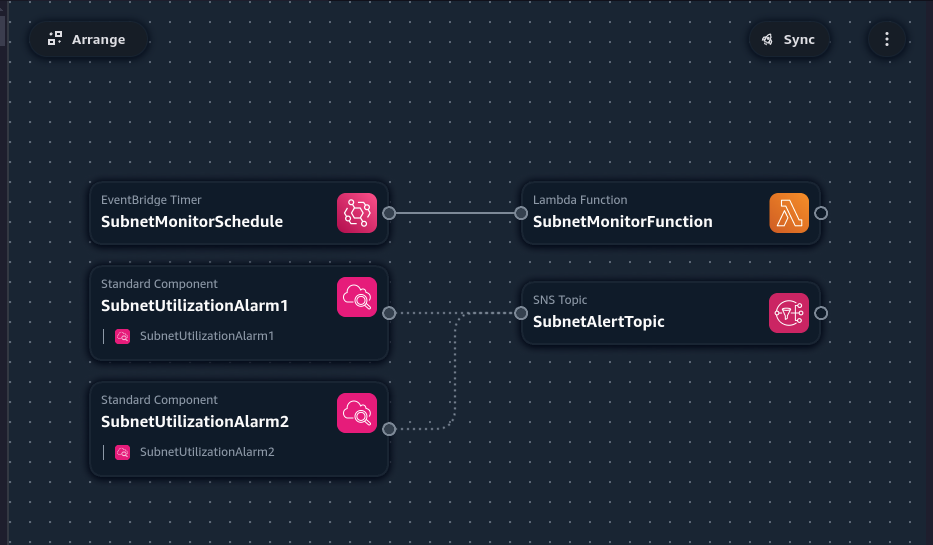
This further enables you design your infrastructure visually, generate Infrastructure as Code and deploy it using AWS SAM (AWS Serverless Application Model) https://aws.amazon.com/serverless/sam/.
AWS CLI installed and configured with appropriate permissions
AWS Toolkit for Visual Studio Code installed and configured
AWS SAM CLI installed
Modify the template.yaml file to adjust default parameter values or add/remove resources as needed. eg: VPC ID, Subnet Name, Subnet ID, CloudWatch Metric Namespace.
(Optional) Update the lambda_function.py file in the src directory.
Build the SAM application: sam build
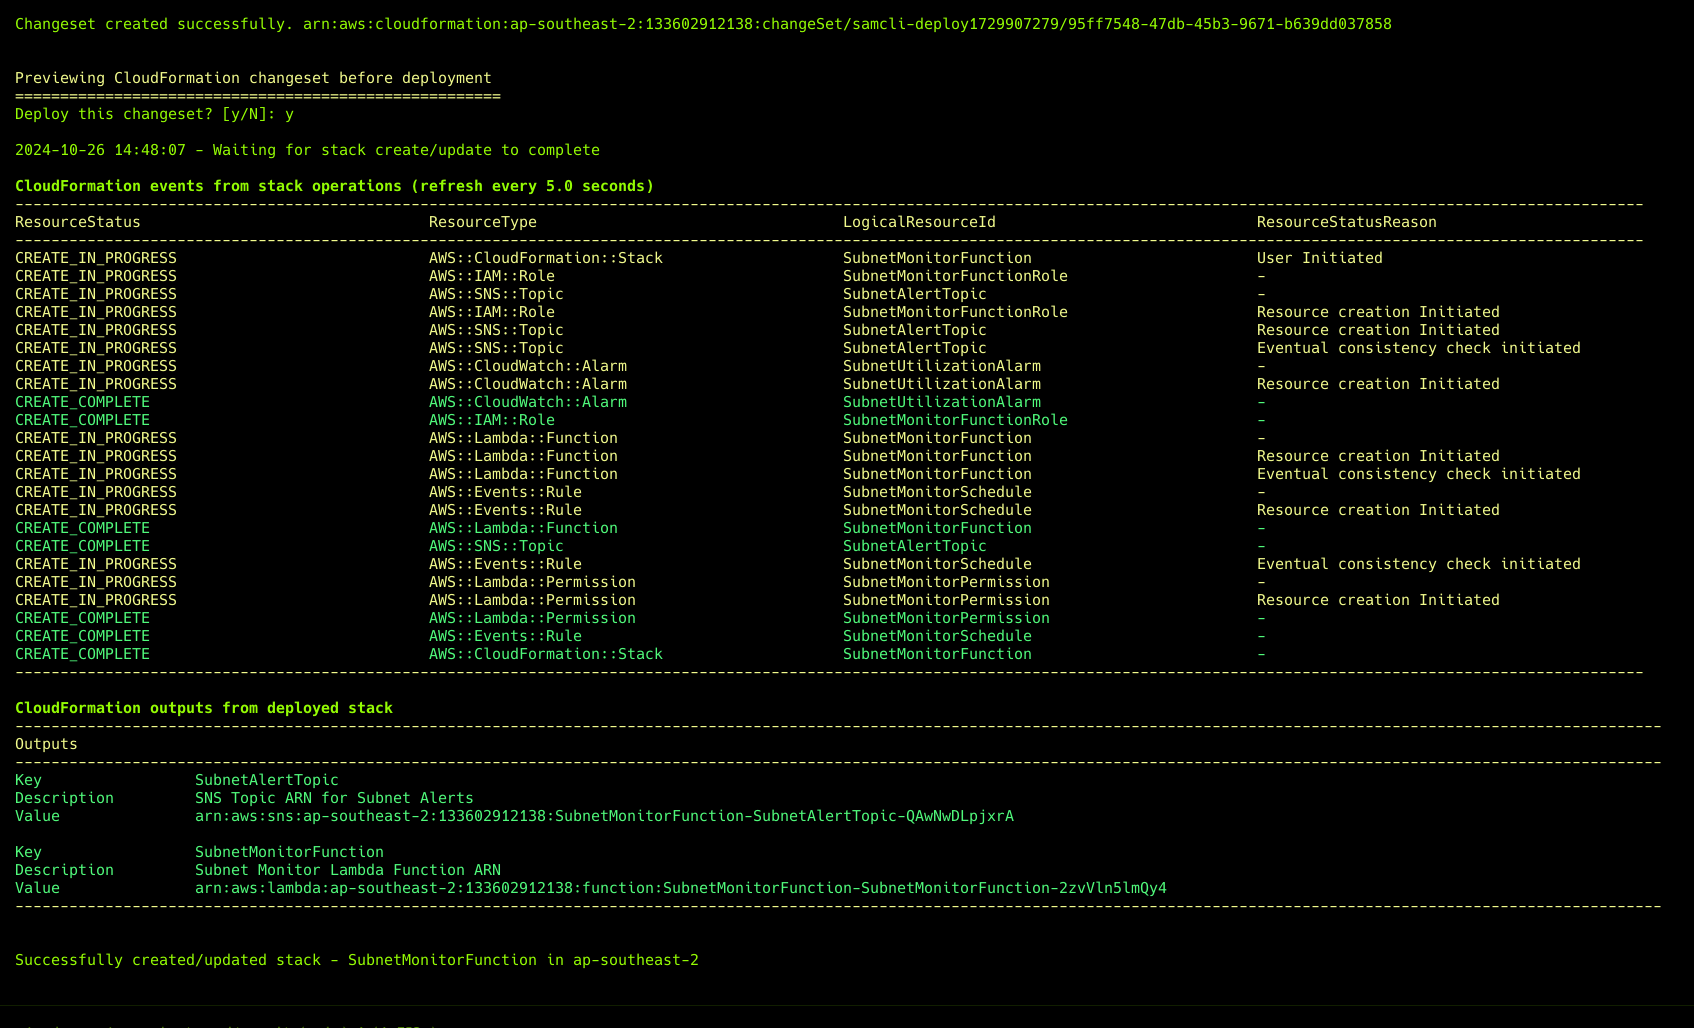
Deploy the SAM application: sam deploy --guided
This will start an interactive deployment process. You'll be prompted to provide values for the parameters defined in the template. You can accept the default values or provide your own.
During the deployment, you'll be asked to confirm the creation of IAM roles and the changes to be applied. Review and confirm these.
SAM will output the ARNs of the created Lambda function and SNS topic once the deployment is complete.
    VpcId: The ID of the VPC to monitor
    SubnetIds: Comma-separated list of subnet IDs to monitor
    SubnetName1: Name of the first subnet
    SubnetName2: Name of the second subnet
    CWMetericNamespace: The CloudWatch metric namespace
    AlertEmail: Email address to receive alerts
Lambda function for monitoring subnets
EventBridge rule to trigger the Lambda function every minute
SNS topic for sending alerts
CloudWatch alarms for each monitored subnet
To monitor more than two subnets, duplicate the SubnetUtilizationAlarm resource in the template and adjust the SubnetIds parameter.
Modify the Lambda function code in src/lambda_function.py to implement your specific monitoring logic.
Adjust the alarm thresholds and evaluation periods in the SubnetUtilizationAlarm resources as needed.
To remove all resources created by this stack: sam delete
Follow the prompts to confirm the deletion of resources.
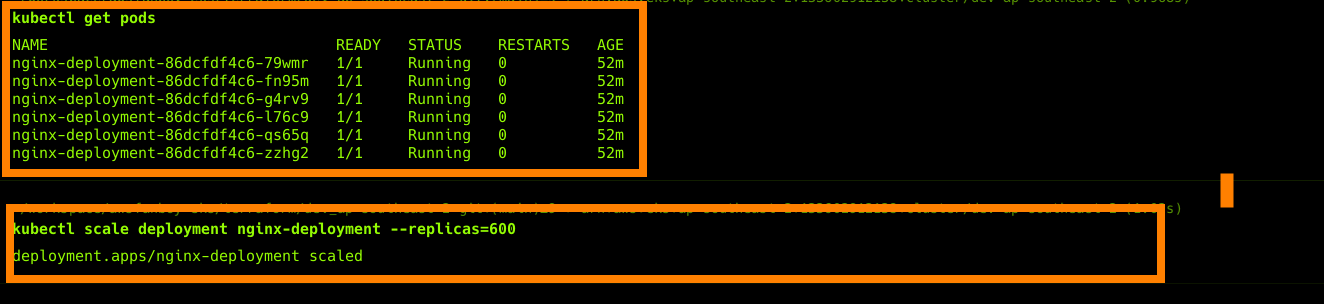
I have an Amazon EKS cluster running a deployment with 6 replicas. Worker nodes are running on 2 Subnets. IP address utilization is looking good.
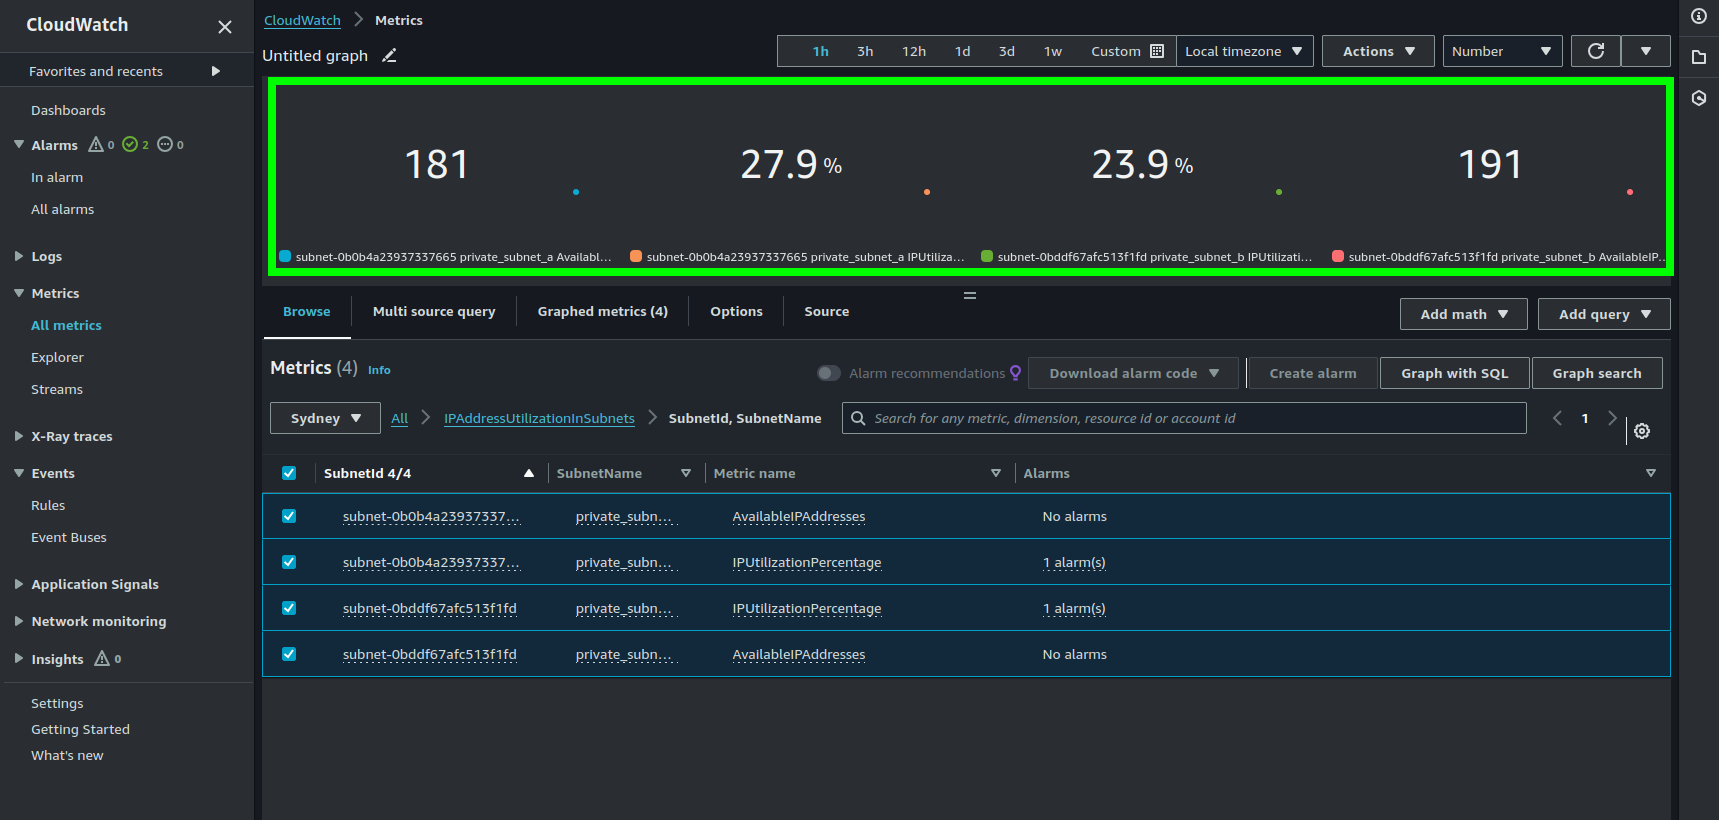
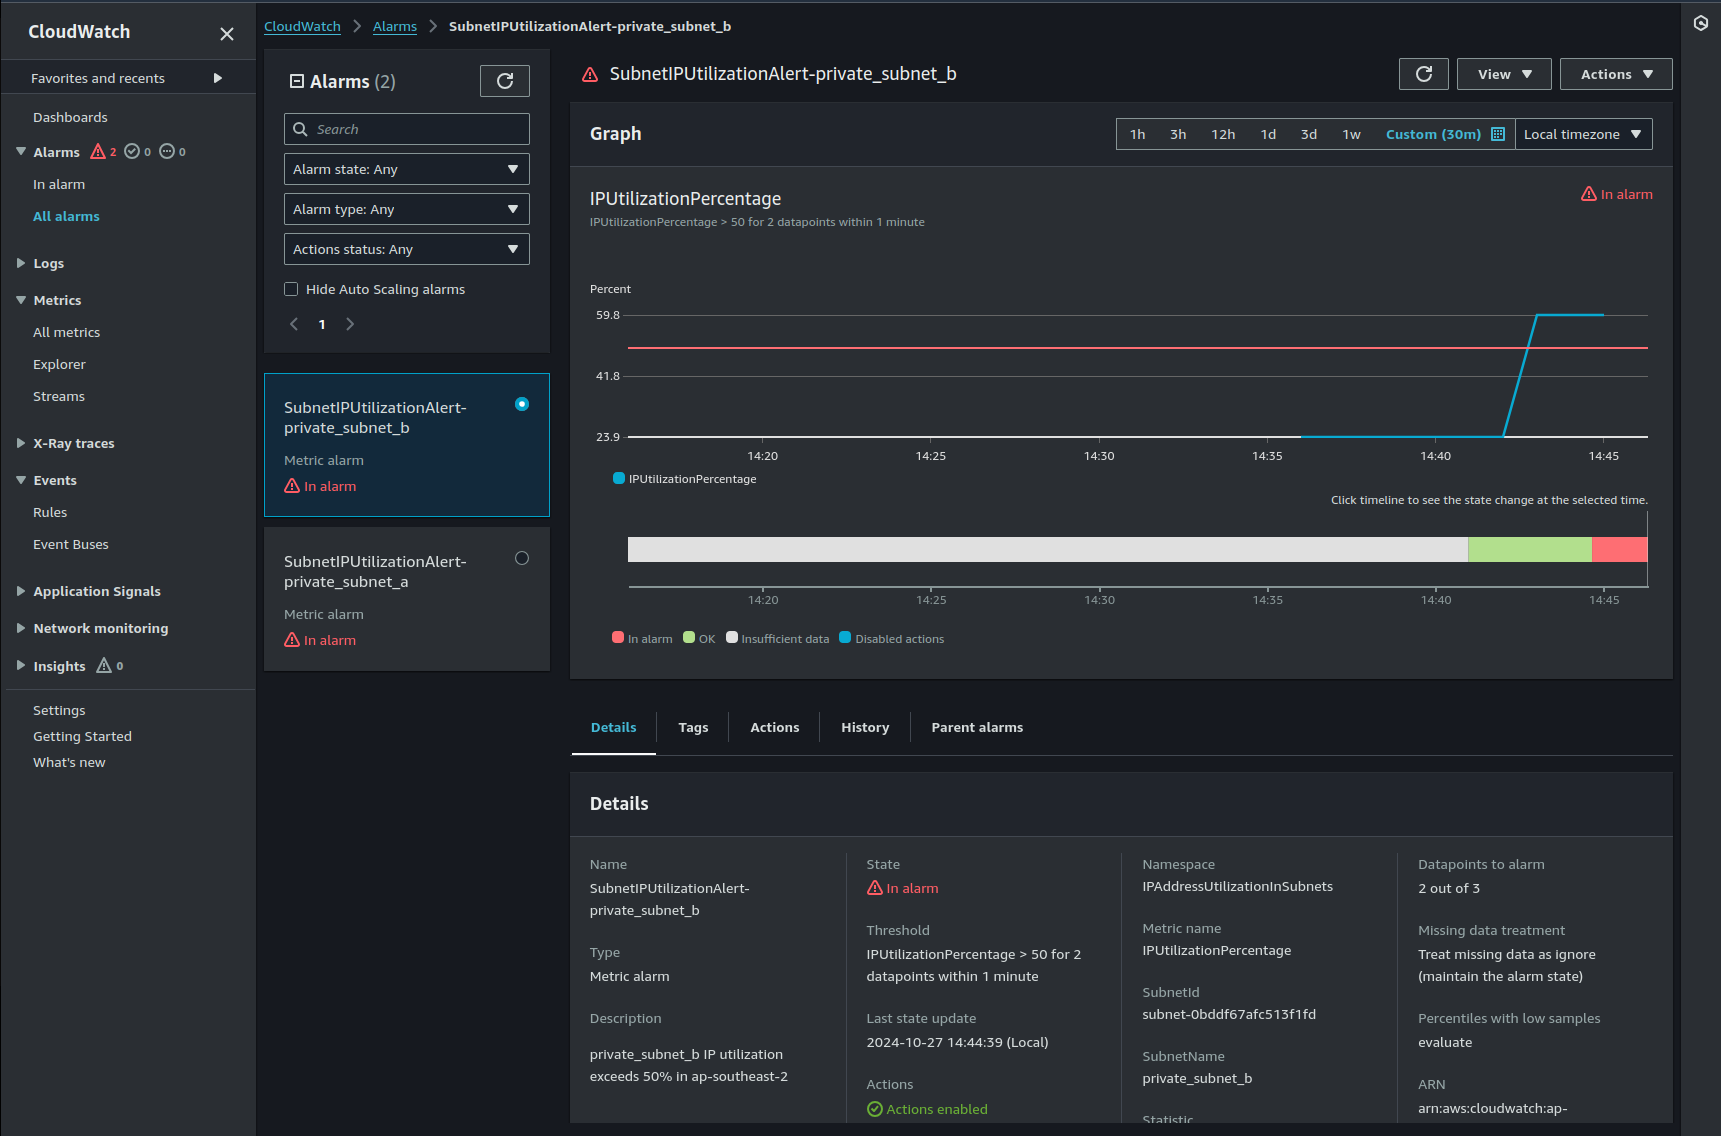
The alarm state is OK.

Okay! let's increase the number of replicas from 6 to 600.


Let's check metrics from the CloudWatch and ooops! now we can see that IP utilization is high.
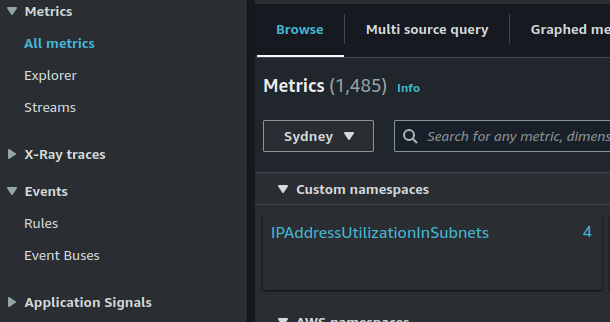
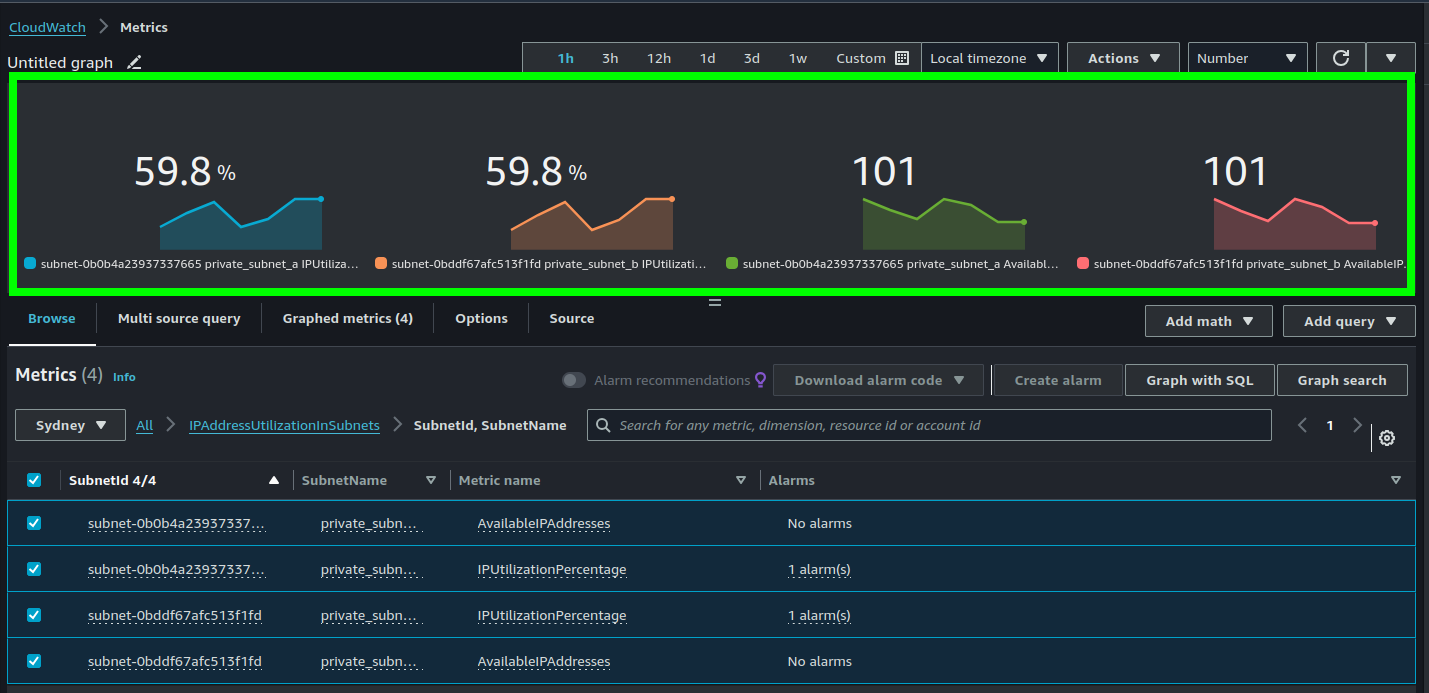
Now, let's check the Alarms in the CloudWatch. Now the state changed from OK to ALARM state.

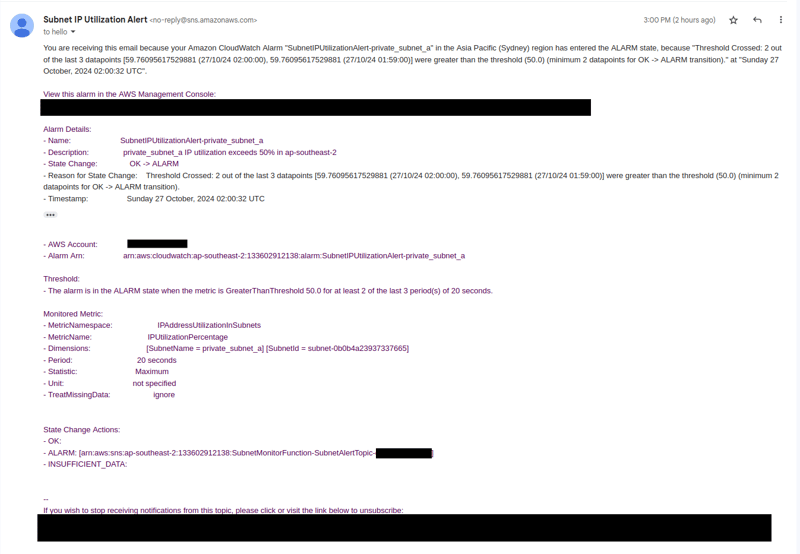
Let's check my emails

I can see there are 2 emails in my inbox.

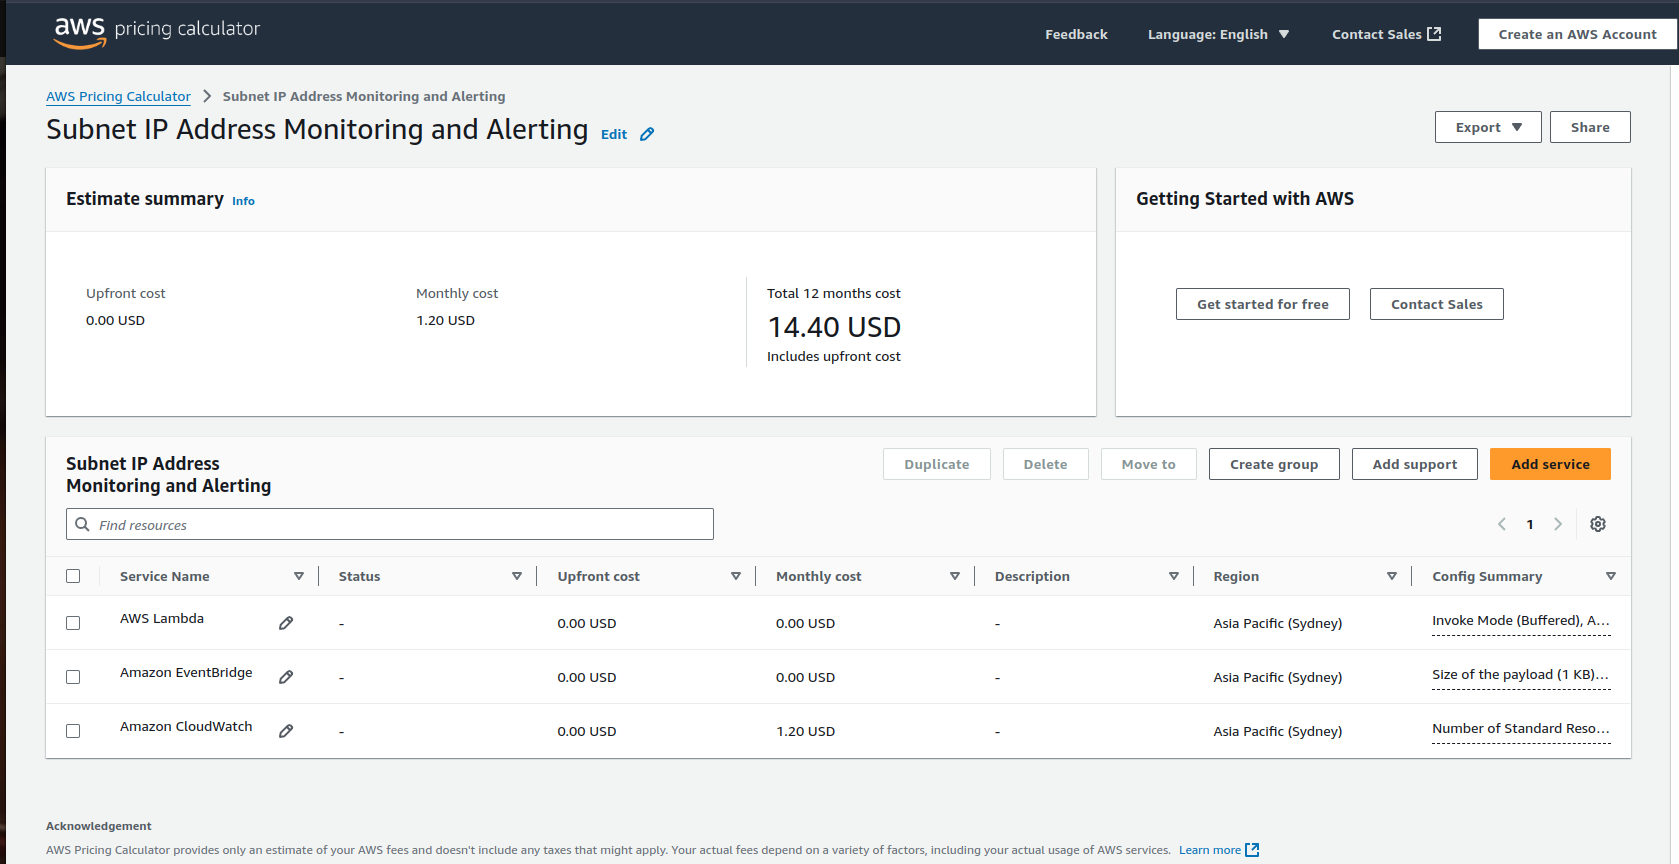
I calculated the cost using calculator.aws, and it appears to be not bad though.

These notifications can be sent to Slack, PagerDuty, and other platforms.
I hope my automation will help someone who doesn't want to use IPAM to monitor IP address utilization in subnets, and I truly wish we could access these metrics straight from CloudWatch.
If you have any suggestions for improvement or if you would like to use anything you currently have in a different way, please feel free to share.